
Core Analytics Engineering: Data Architectures
Get the data architecture right, and everything else becomes easier.

Before we dive into the technical details, let’s talk about what data architecture really is. At its core, data architecture is just the set of rules, standards, and patterns that govern how data flows through your organization. It’s the blueprint that determines the following:
Where different types of data live
How data moves from system to system
What happens to data as it gets transformed
Who has access to what data
How data quality is maintained
How new data sources get integrated
Think of it as the layout of a city. You have residential areas, commercial districts, industrial zones, and transportation networks that connect everything together. Each zone serves a specific purpose, and the way they’re connected determines how efficiently the city functions.
In the data world, your architecture determines whether your organization is like a well-planned city with efficient highways and clear zoning, or like a metropolis that grew without any planning and now has traffic jams everywhere.
Here’s a story that illustrates this perfectly. We once worked with a company that had grown rapidly through acquisitions. They had inherited data systems from each company they bought, and nobody had ever taken the time to think about how all of it fit together.
Their data “architecture” looked something like this:
Customer data residing in five different CRM systems
Financial data split between three different ERPs (Enterprise Resource Planning)
Marketing data scattered across dozens of disparate solutions
Each system had its own definition of basic concepts like customer and revenue
Getting answers to simple questions required manually combining data from multiple sources
The outcome? Their “weekly” business review actually took two weeks to prepare because analysts spent most of their time just figuring out how to join the data together. Leadership couldn’t make quick decisions because they never trusted the numbers. And the data team was constantly putting out fires instead of providing strategic value.
Six months later, after implementing a well-thought-out data architecture, the same company could do all of this:
Generate their weekly business review in under two hours
Answer ad-hoc questions from leadership in minutes instead of days
Trust their metrics enough to base major business decisions on them
Onboard new data sources in days instead of months
The difference wasn’t the latest technology or huge budgets. It was simply having a thoughtful approach to how data should be organized and managed.
And as an analytics engineer, understanding data architecture isn’t just helpful – it’s absolutely essential. Here’s the reasoning: every single day, you’re going to make decisions about how to structure data, where to store it, how to transform it, and how to make it accessible to others. These decisions might seem minor in the moment—Should I create this as a view or a table? Where should I put this transformation logic? How should I organize these datasets?but they add up together to create the foundation that your entire analytics ecosystem sits on.
In the following sections, we’ll introduce the core data architectural types and their main concepts, so that once you start designing your own analytics solutions, you’ll have a thorough understanding of both the strengths and weaknesses of each of these architectures. Please bear in mind that this is by no means a definitive guide to data architectures, as we don’t have the space to delve into the nitty-gritty details of each type. If you want to know each data architecture type in more depth, we recommend the book Deciphering Data Architectures by James Serra (O’Reilly, 2024).
Fasten your seatbelts, as we are now taking you on a journey through the history of data architectures!
The Data Architecture Evolution
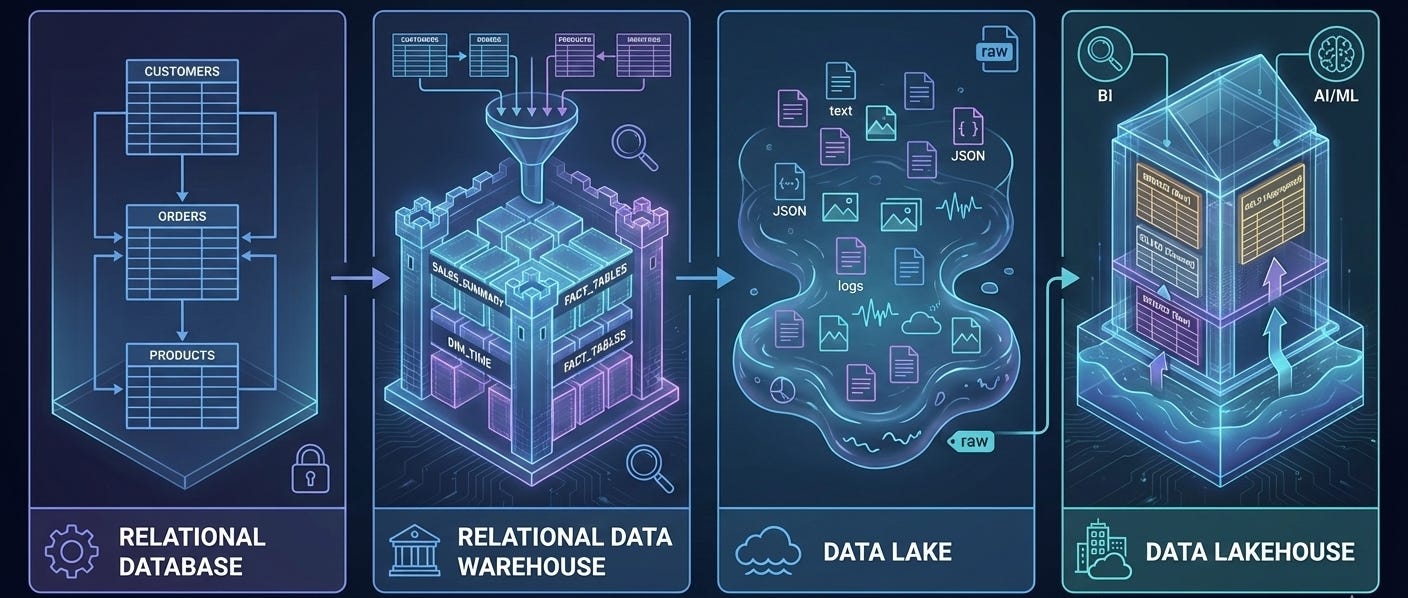
The current data architecture landscape has a long history. As with any kind of technology, data architectures have been evolving to support the latest innovations and requirements. In the following sections, we will discuss key characteristics of the following data architectures:
Relational databases
Relational data warehouses
Data lakes
Data lakehouses
Data fabric
Data mesh
Event-based architecture
This is the excerpt from the early release of the “Analytics Engineering with Microsoft Fabric and Power BI” book, which I’m writing together with Shabnam Watson for O’Reilly. You can already read the early release, which is updated chapter by chapter, here.

Relational Operational Database
Relational databases may be rightly considered the fine old wine in the data architecture realm. They have a long history, going all the way to the 1970s, when Edgar F. Codd proposed the relational model as a way to organize data.
At its core, a relational database is a highly organized, digital filing cabinet. For decades, it’s been the gold standard for storing business data for an extremely simple reason: it’s incredibly reliable. Think of each table in the database as a drawer in the cabinet, dedicated to one thing - say, customers or orders. Each row in a table is a single file folder (one customer, one order), and each column is a specific piece of information on a form inside that folder (a customer’s name, their email address, the order date, and so on).
The relational part is where the power comes from. It means the database understands how these tables are connected. It knows that the customer X in the Customers drawer is the same Customer X who placed the order in the Orders drawer. This structure is what allows us to ask complex questions using a language called SQL (Structured Query Language). SQL is just how you tell the database: Go get me all the orders placed by customer X.
When you work with these organized systems, you have to follow a strict rule called schema-on-write. Think of building a house: you must have a detailed blueprint (the schema) before you can even start laying the foundation. You define every room, every window, and every doorway upfront. The data must fit this blueprint perfectly when you save - or write - it. This upfront work ensures everything is consistent and the data is trustworthy.
The opposite approach, common in more flexible systems like data lakes, covered in one of the following sections, is schema-on-read. This is like dumping all your building materials - bricks, wood, windows - into a big pile. There’s no blueprint to start. You only decide how to structure it all when you need to build something, or when you read the data. It’s incredibly flexible and great for storing all kinds of messy, unstructured information, but it puts the responsibility of making sense of it all on the person analyzing it later.
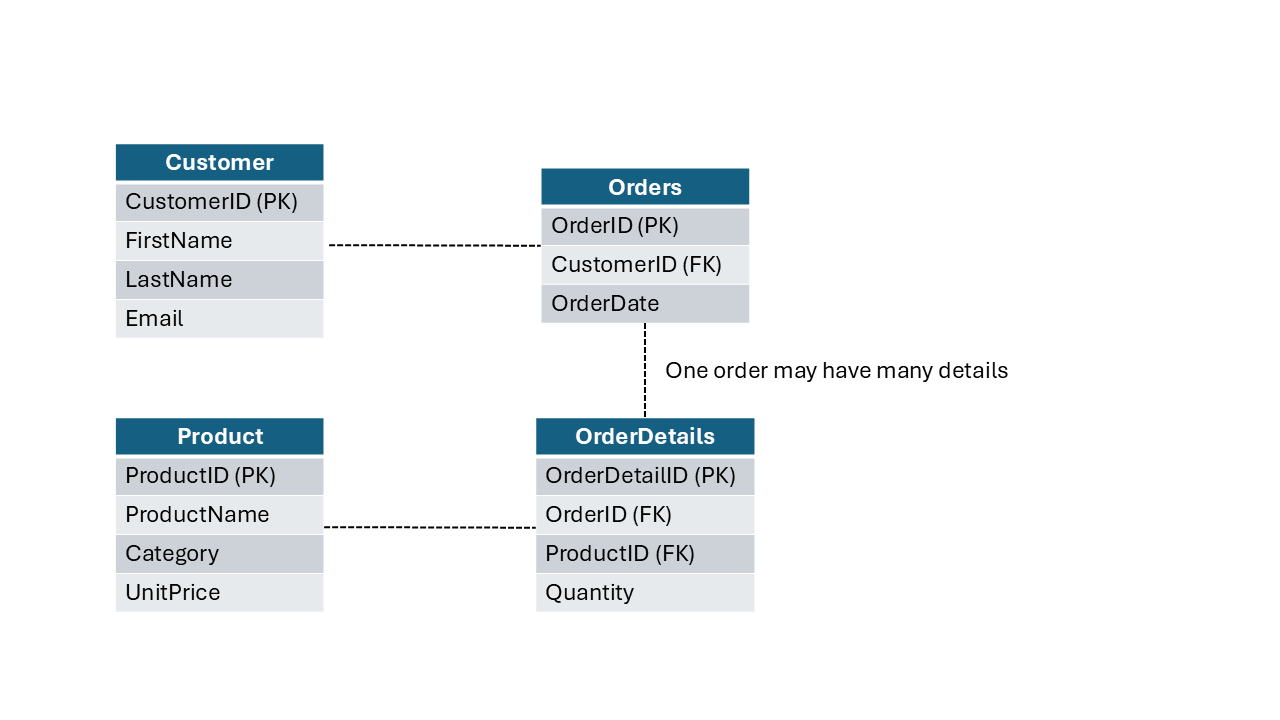
Let’s break down a typical relational database structure. Figure below displays a simplified relational model that consists of four tables: Customer, Product, Orders, and OrderDetails.
If you don’t understand each piece in this illustration, don’t worry too much. In the next article, we will cover various data modeling concepts in depth.
Let’s briefly look at a couple of key points from the figure above:
Each table stores the information about a specific type of object
Each column represents the property, or attribute of the object defined within a table (e.g., FirstName, ProductName, OrderDate, etc.)
Some columns are different from others. These columns are used to uniquely identify records and connect tables:
Primary key (PK): A unique identifier for each record within a table
Foreign key (FK): A field in one table that uniquely identifies a record in another table, and as such, is used to connect two tables
Relationships are connectors between tables. In relational databases, relationships are enforced through schema design and constraints, not by creating separate relationship objects like in some other systems. For example, the CustomerID from the Customer table is also stored in the Orders table as a foreign key, allowing us to see all orders placed by a specific customer. In this particular case, one customer may place multiple orders, so we are talking about the one-to-many (1:M) relationship here. We cover relationships in detail in the next chapter
That example illustrates what’s known as a normalized structure - a design approach that organizes data efficiently by minimizing redundancy. This normalized structure - and, again, don’t stress if you don’t know what normalized structure is yet, as the next chapter explains it in detail - is highly efficient in scenarios when you need to frequently write or update the data. For example, a product name is stored only once in the Product table. Therefore, even if that product is sold five million times, you only need to update its name in one single place within the database, and the change will be immediately applied everywhere.
Relational Data Warehouse
In bygone days, relational databases were the undisputed kings of the data world. They were, and still are, fantastic at running the daily operations of a business, like processing orders, managing inventory, or updating customer records. We refer to these as operational or transactional (aka OLTP, which stands for online transactional processing) systems, and they must be lightning-fast. When a customer places an order, you can’t have them waiting around.
But this created a huge challenge. We call this the Don’t touch the live system! challenge. Business leaders needed answers to questions such as How many widgets did we sell last quarter? And Which products are most profitable? They needed to analyze the data to find insights.
But if you tried to run a big, complex analytical query on the same live database that was busy processing thousands of transactions a minute, everything would grind to a halt. It was like trying to do a deep, detailed inventory count in a busy supermarket during peak hours - you’d just get in everyone’s way and slow the whole operation down. This conflict between fast ongoing transactions and slow, heavy analysis was a major headache. The solution was to create a separate playground for analysts.
The invention of the relational data warehouse (RDW) solved the problem brilliantly. The concept was simple yet powerful: instead of running reports on live systems, you create a copy of all your important data from various operational systems (Sales, Inventory, CRM, and so on) and centralize it in a separate, dedicated database built specifically for analysis.
This was a true game-changer for two main reasons:
It protected the live systems. Analysts could now run massive, complex queries in their own playground (the data warehouse) without any risk of slowing down the daily business operations.
It created a single source of truth. For the first time, you could pull data from your sales system, your inventory system, and your customer relationship system into one place. This allowed you to answer much more sophisticated questions, like What is the lifetime value of customers who buy Product X? as shown in the diagram.
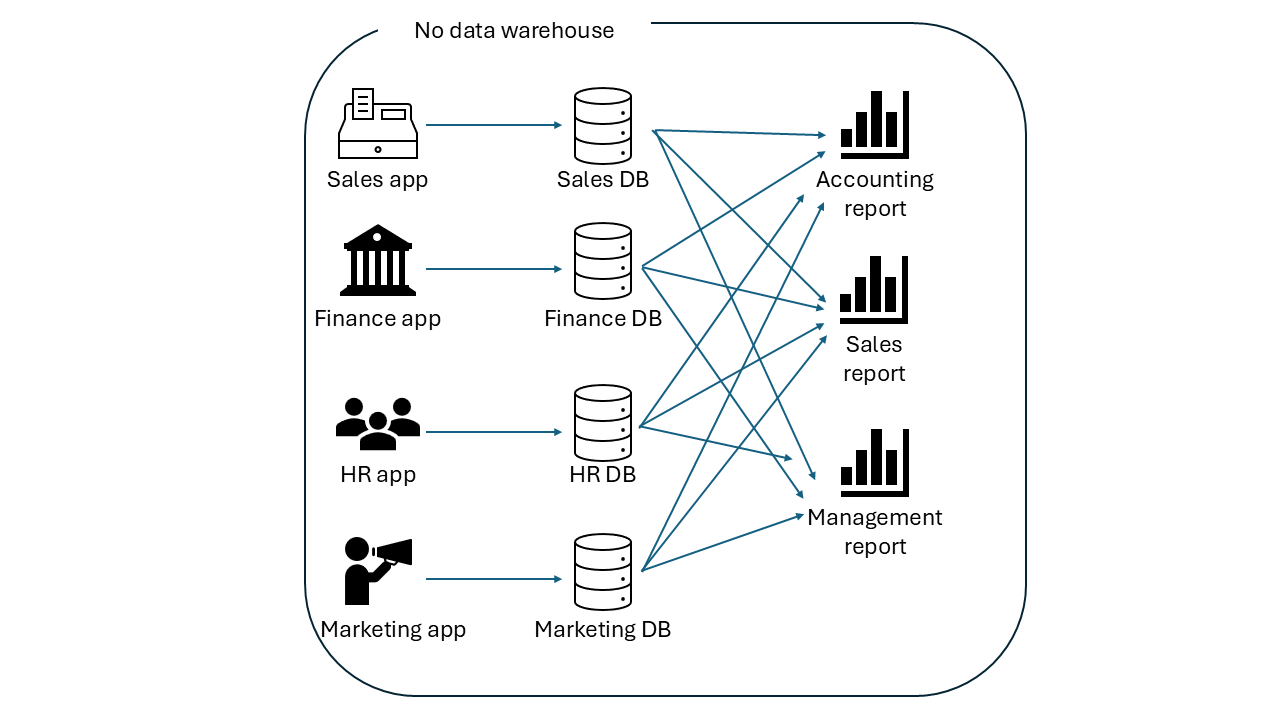
The illustration below best describes the need to implement a data warehouse. You may notice how complicated and inefficient it is to run a report that retrieves the data from multiple applications, where each business unit creates a report that retrieves the data from all the databases connected with each application. It’s fair to say that this is total chaos.
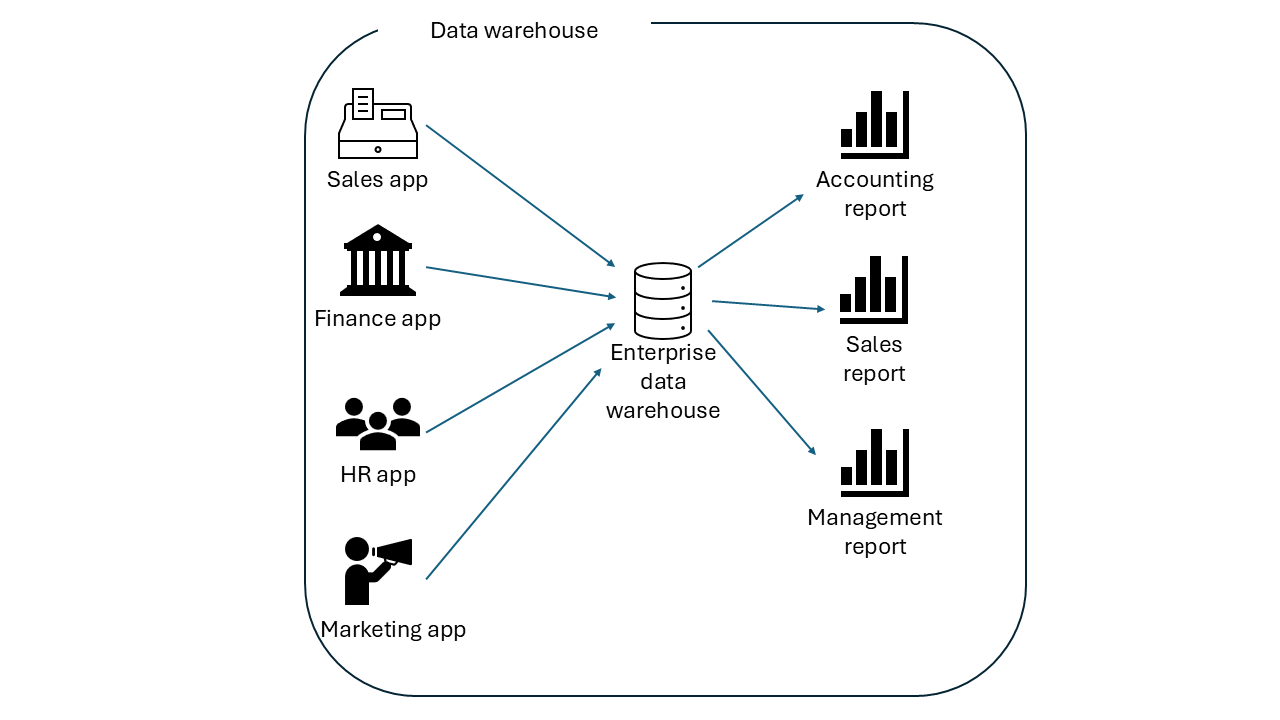
On the other hand, when you copy the data from all the applications into a data warehouse, life becomes much easier, as shown below.
Conceptually, a data warehouse is just a copy of the data stored in transactional processing systems. But, technically, it’s more than just a copy. It’s a special type of relational database optimized for high-speed analytical queries on huge volumes of data. It comes with its own powerful compute engine designed to slice, dice, and aggregate information, giving businesses a comprehensive view of their performance that was impossible before.
Essentially, the data warehouse gave businesses the best of both worlds: rock-solid, fast operational systems and a powerful, dedicated environment for deep data analysis.
In a typical scenario, a data warehouse is built by leveraging data pipelines that perform three core steps, or actions, called extract, transform, and load (ETL). Chapter 1 already discussed the shift from ETL to ELT paradigm, when we examined the circumstances that enabled the rise of analytics engineering.
Before examining the two most common approaches to creating a data warehouse, we’ll first highlight one of the main pitfalls in numerous real-life data warehouse implementations. As in many other scenarios, a lack of planning can easily come back to haunt you. Data warehouses are not an exception to this rule. What usually starts as a simple, one-off solution for a small number of users may later expand and become a real data monster. Thus, you should spend some time planning the data warehouse implementation.
We can segregate two fundamental approaches for building a data warehouse, and the following sections explore them in depth.
Top-down approach
This method starts with designing the overall data warehouse architecture and then creating data marts for specific business units, as shown in the illustration below.
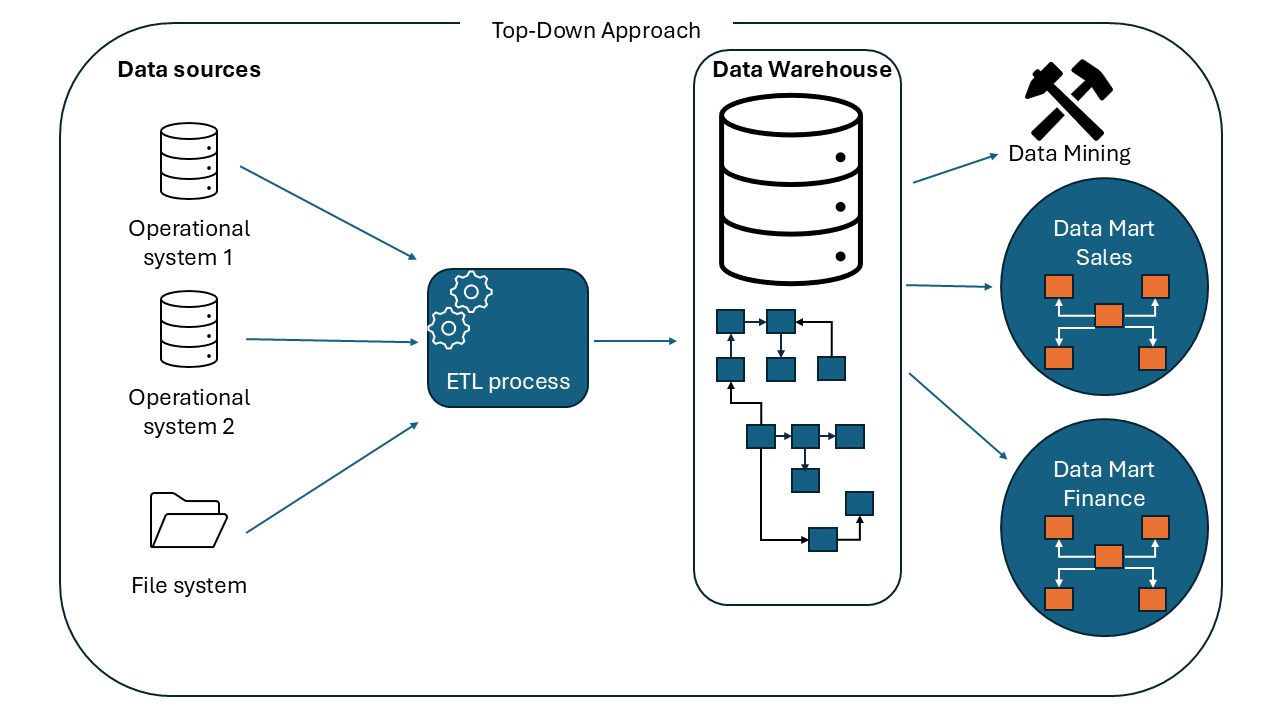
This method was introduced by Bill Inmon, widely recognized as the father of the data warehouse. It begins with building a centralized, company-wide data warehouse. The data is normalized to avoid redundancy. This centralized repository serves as a single source of truth for managing and analyzing the data across the entire organization.
