
Logical Data Management: Why "Just a quick number" is never quick...
A true life story about the gap between available data and a trusted number.

Logical Data Management series
Logical Data Management: Why “Just a quick number” is never quick... (this article)
Sara is a data analyst. She has been in her current position for three years, and she’s doing a quite good job. Sara is the kind of person other people in the company definitely rely on when they need something figured out. It’s Tuesday. Nothing special about it.
At 9:14 in the morning, a message arrives from the VP of Sales.
“Hey, quick one. Can you get me revenue by region for the last quarter? Board meeting Thursday. Thanks!”
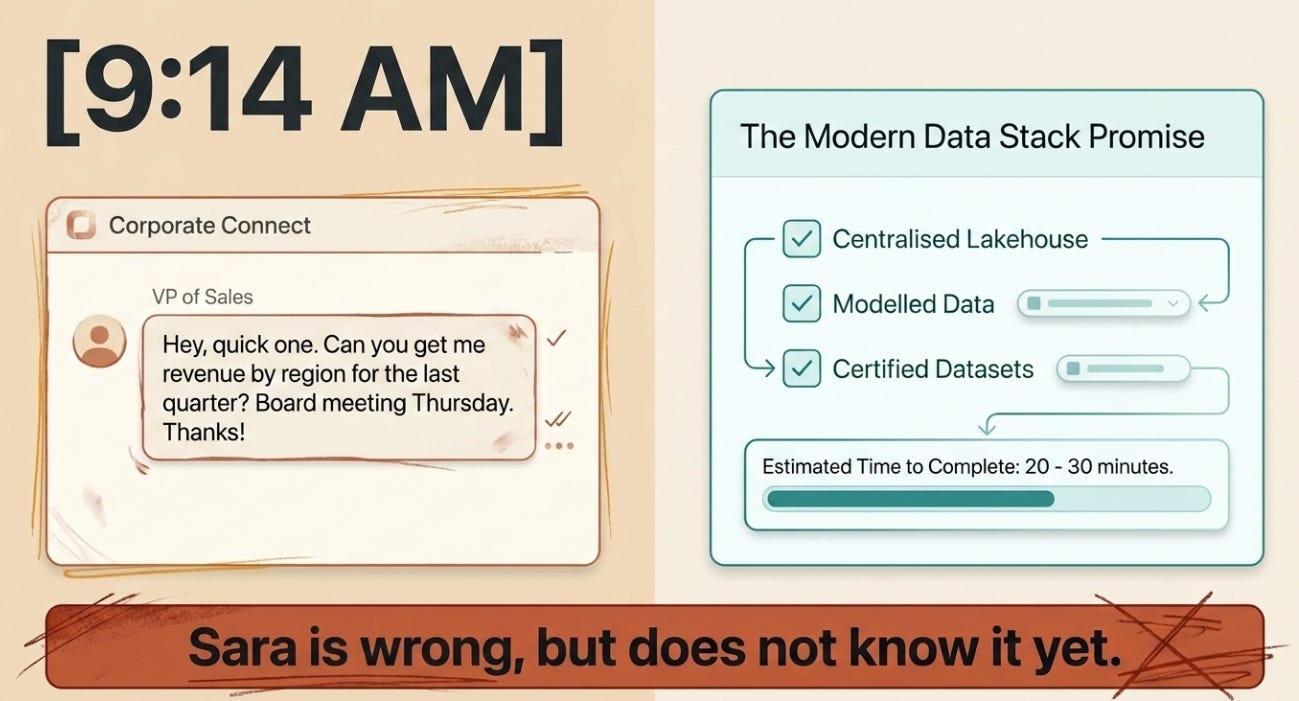
Sara reads it and thinks: sure. Twenty minutes, maybe thirty. We have a whole data platform for exactly this. There is a lakehouse. There is a semantic model. The model is even certified. This is the easy kind of request.
Sara is wrong, but does not know it yet.
9:30. The first fork in the road.
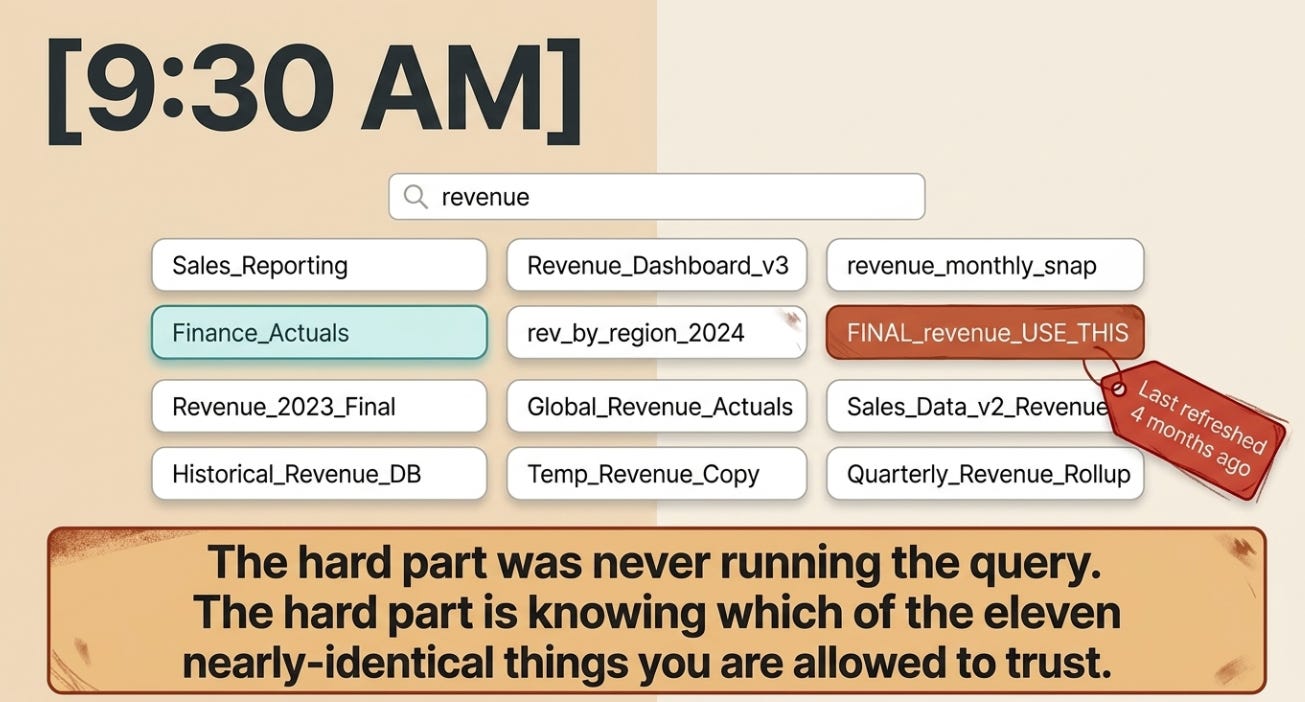
Sara opens the BI tool and searches for “revenue.”
Eleven results come back. Eleven datasets, each with some version of a revenue measure. There is Sales_Reporting. There is Finance_Actuals. There is Revenue_Dashboard_v3. There is something called FINAL_revenue_USE_THIS that was last refreshed four months ago, which is not reassuring given the name.
Which one is right?
This is the first thing nobody tells you about self-service analytics. The hard part was never running the query. The hard part is knowing which of the eleven nearly-identical things you are allowed to trust.
Sara picks the one that looks most official, Finance_Actuals, because finance sounds authoritative, and opens it up.
9:50. The definitions do not agree.
The numbers in Finance_Actuals do not match the numbers Sara remembers from a report last month.
Not by a little. By about eight percent.
Sara frowns and starts digging. After a while, the reason surfaces: Finance_Actuals recognizes revenue on shipment, while the sales team has always talked about revenue on order. So the finance number and the number the VP is expecting in their head are measuring two different things. Both are correct. They just answer different questions.
Now Sara has a problem that has nothing to do with data and everything to do with meaning. Which definition does the VP actually want? Probably the sales definition, since it is the VP of Sales asking. But the board might expect the finance definition, because that is what shows up in the official financials.
Sara does not know. So Sara sends a message asking, and waits.
11:20. Still waiting, so let us try the other path.
The VP has not replied. They are, presumably, in meetings, because VPs are always in meetings:)
Sara decides to hedge and build both versions. Sales definition and finance definition, side by side, so the VP can pick. Reasonable plan.
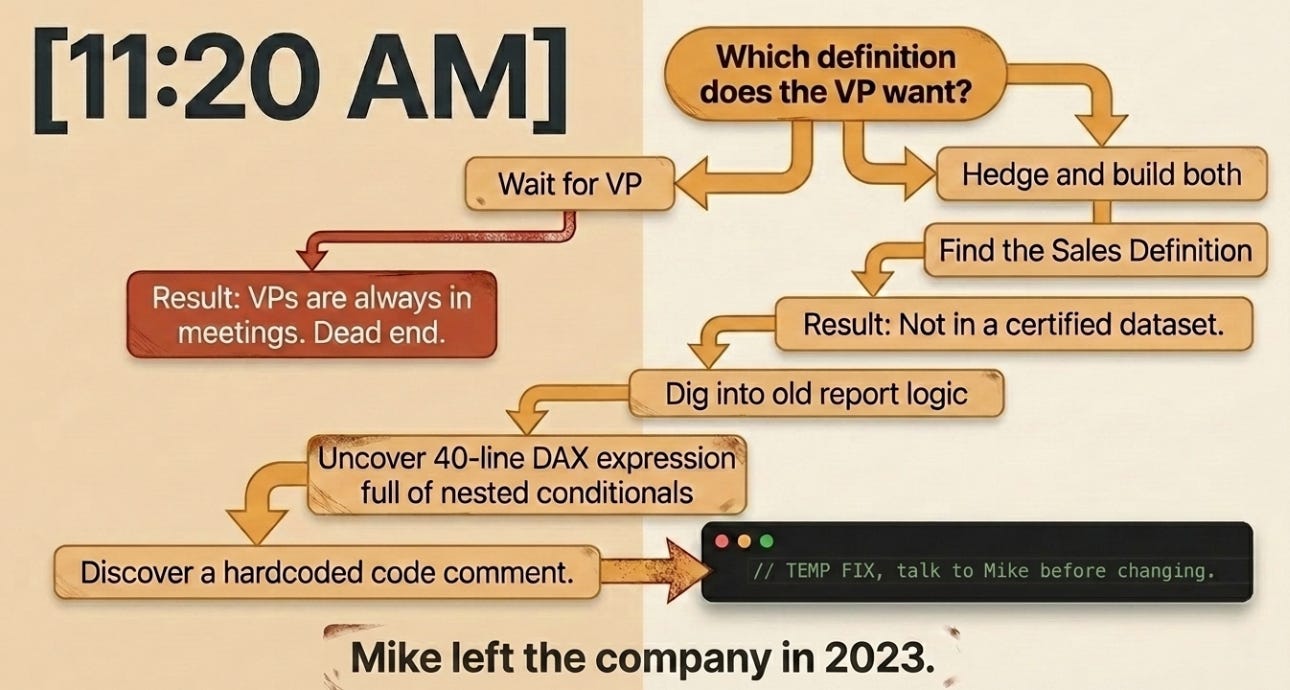
Except the sales definition is not in a certified semantic model anywhere. It lives in the logic of an old report that someone built years ago. Sara opens that report to see how the measure was defined, and finds a DAX expression forty lines long, full of nested conditionals, with a comment near the top that just says “TEMP FIX, talk to Mike before changing.”
Mike left the company in 2023.
Let us pause here for a second.
I want to step out of the story, because I suspect a lot of you reading this stopped seeing Sara a while ago and started seeing yourself.
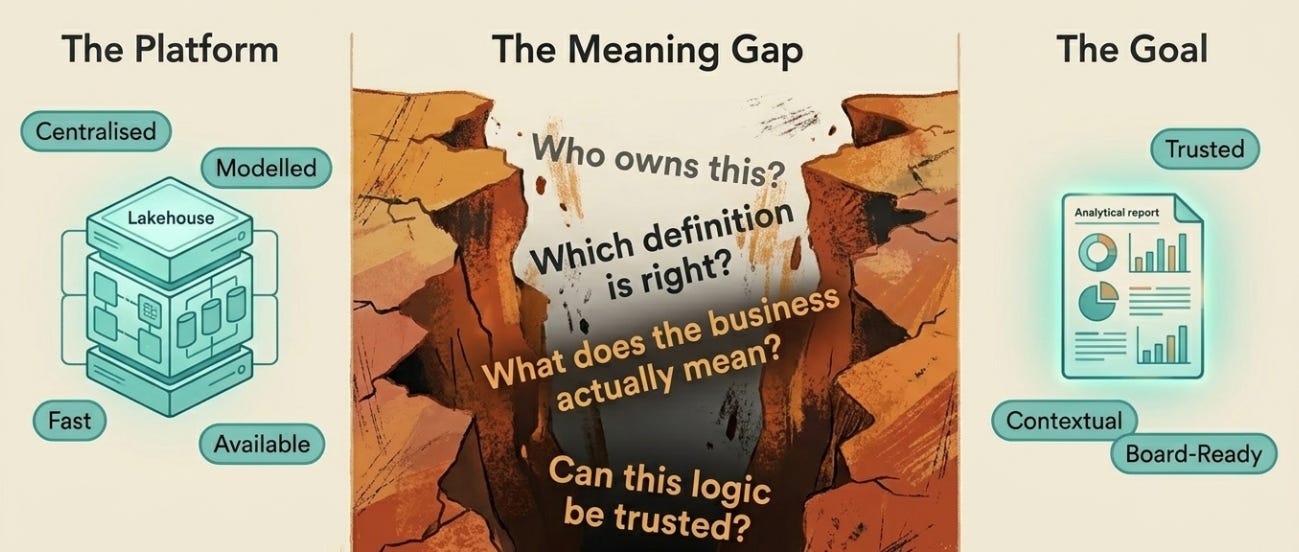
Here is what has actually happened in the two hours since that cheerful 9:14 message. Sara has not yet produced a single number. And it is not because Sara is slow, or because the tools are bad, or because the data is missing. The data is all there. It has been centralized, modeled, and made available. The platform is doing its job.
What is missing is everything around the data. Which definition is the right one? Who owns it? Whether the logic can be trusted. What the business actually means by “revenue” in this specific context for this specific audience.
None of that lives in the lakehouse. It lives in conversations, in tribal knowledge, in the head of a person named Mike who does not work here anymore.
This is what I meant, in the earlier articles in this series, when I said the bottleneck moved. We solved the problem of where the data lives. We did not solve the problem of what it means and who decides. And self-service analytics, for all its promise, quietly handed that unsolved problem to the analyst.
We told people: here are the tools, here is the data, go serve yourself.
What we did not say is that serving yourself also means navigating, alone, a maze of undocumented definitions, orphaned logic, and competing versions of the truth, with no map.
Self-service became self-navigation.
1:45. A reply, of sorts.
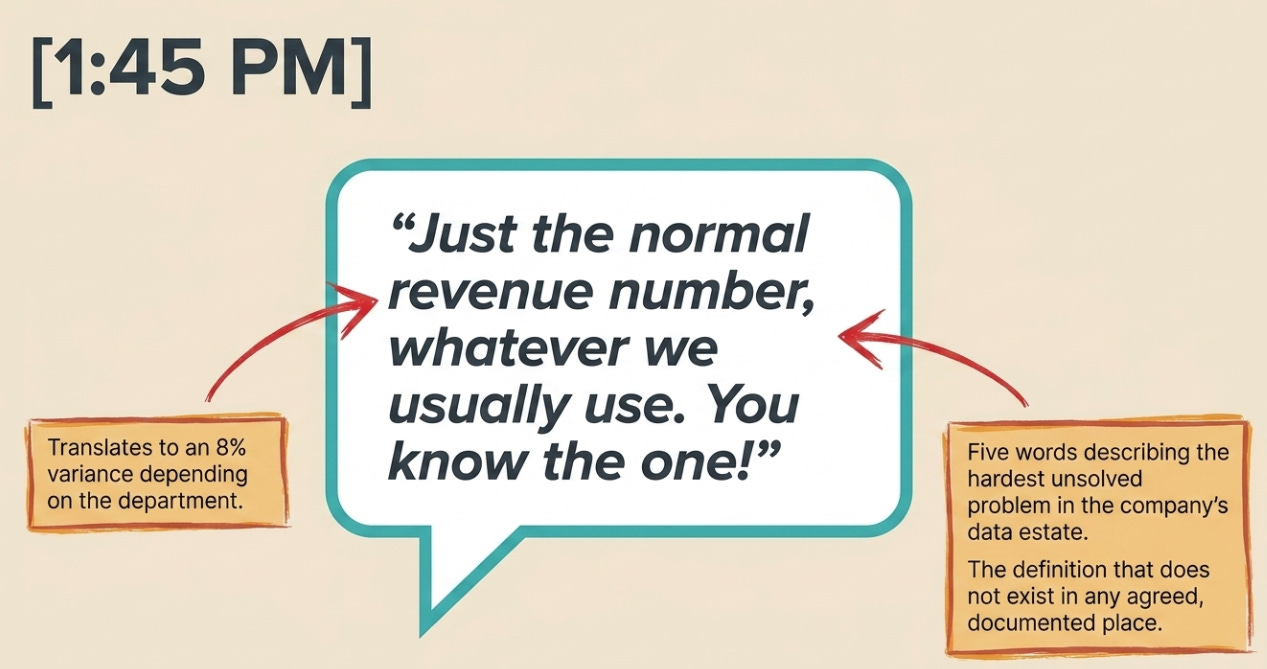
The VP responds: “Just the normal revenue number, whatever we usually use. You know the one!”
Sara does not, in fact, know the one. “Whatever we usually use” is precisely the thing that does not exist in any single, agreed, documented place. That is the whole problem, compressed into five words by someone who has no idea they have just described one of the hardest unsolved problems in the company’s data estate.
Sara makes a decision. Sales definition, because the audience framing suggests it, with a footnote noting the finance figure differs and why. It is a judgment call. A reasonable one. The kind analysts make a dozen times a day without anyone realizing a call was even made.
3:30. It is mostly done. Is it right?
The report looks good. Revenue by region, last quarter, clean and clear.
Sara stares at it for a moment with the specific unease that every analyst knows. The numbers are plausible. They are probably correct. But “probably correct” is doing a lot of work in that sentence, and Sara is aware that on Thursday this slide goes in front of the board, and if the number is off, or if it somehow uses a definition the CFO disagrees with, the person whose name is attached to it is Sara.
There is no way to be sure. There is no system that will confirm “yes, this is the trusted regional revenue figure, blessed by finance, current as of this quarter.” There is only Sara’s judgment, a footnote, and a small knot of doubt.
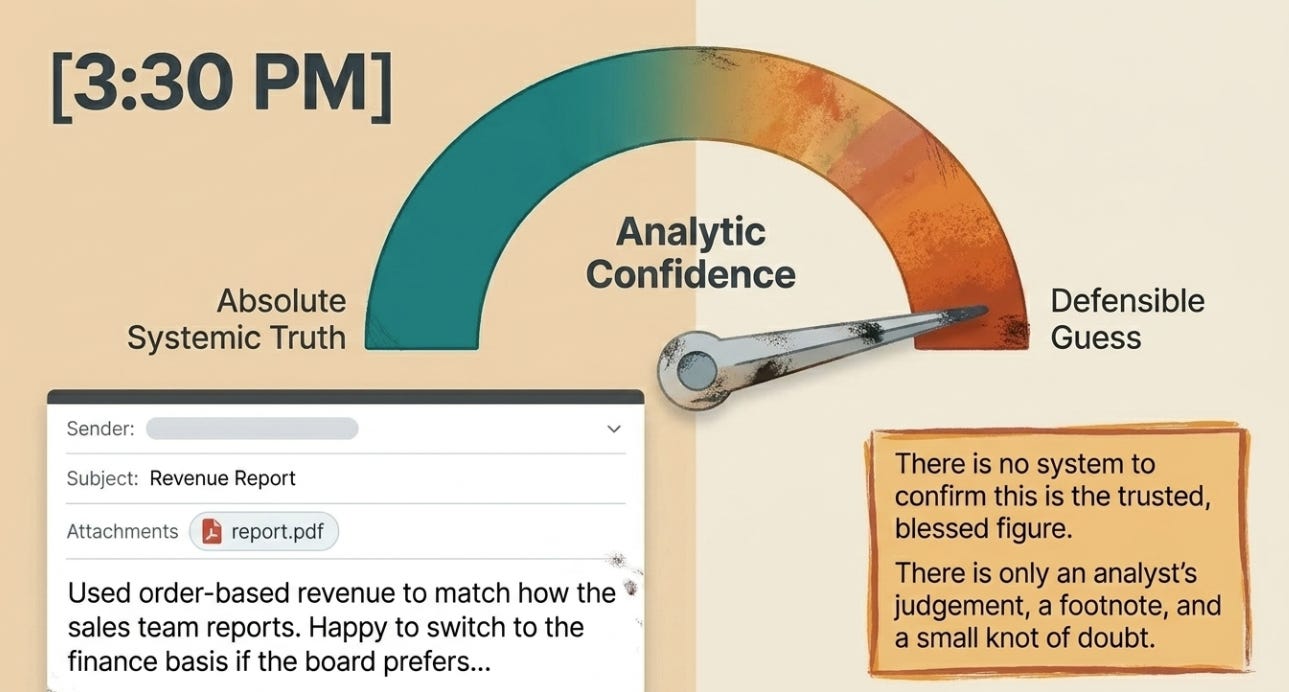
Sara sends the report. Adds a careful note: “Used order-based revenue to match how the sales team reports. Happy to switch to the finance basis if the board prefers, just let me know.”
Then Sara closes the laptop and goes home.
So, did it work?
Honestly, I do not know. And that is the point.
Maybe the number was exactly right and the board nodded along and nobody thought about it again. Maybe someone in the room said “that does not match the figure in the financials” and there was an awkward few minutes. Maybe the report sat in an inbox unopened. Most analytics requests end this way, not in triumph or disaster, but in a kind of unresolved haze where you ship something defensible and move on to the next fire.
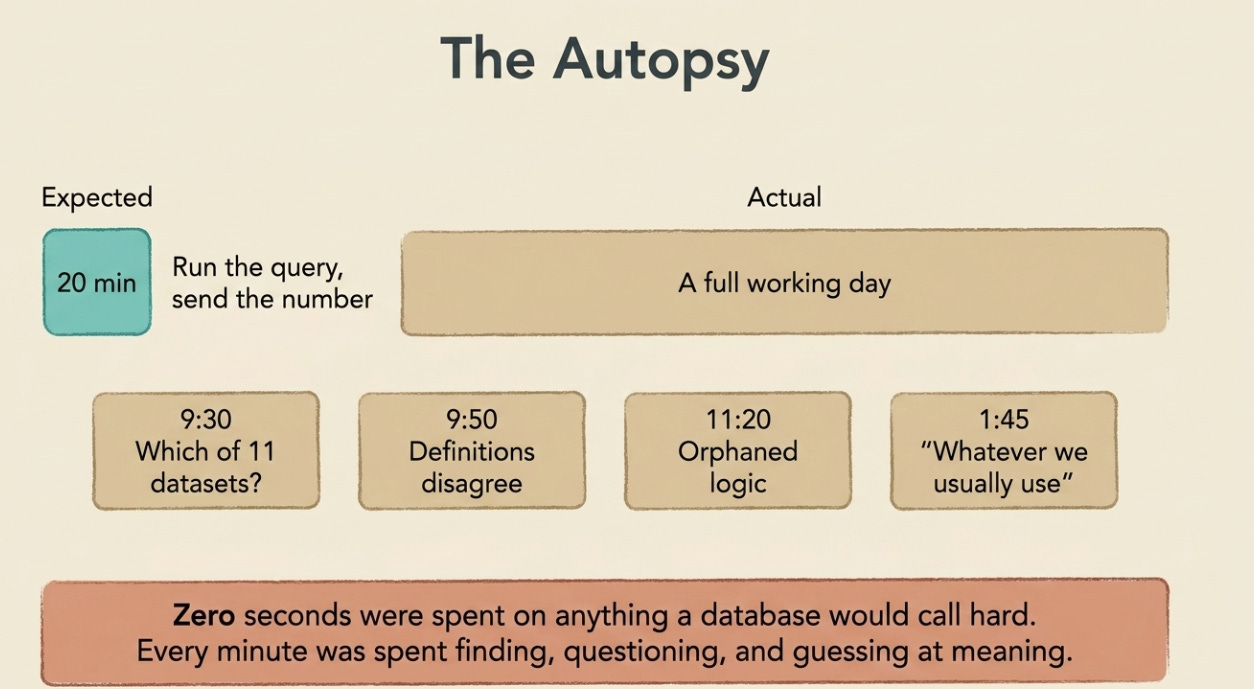
What I am certain of is this. A request that everyone, including Sara, assumed would take twenty minutes consumed most of a working day. Not one second of that day was spent on anything a database would recognize as hard. The query itself would run in under a second. Every minute was spent on meaning: finding it, questioning it, reconciling it, and finally just guessing at it.
Multiply that Tuesday across every analyst in your organization, across every “quick one” that lands in their inbox, and you start to see the real cost. It does not show up in your cloud bill. It does not appear on any dashboard. It hides inside the gap between “the data is available” and “the answer is trusted,” and in most organizations that gap is enormous, and almost entirely invisible.
We have spent a decade making the data easier to reach. Sara’s Tuesday is what is left over. It is the part we have not solved yet.
In the next article, we will finally start talking about how to close that gap, beginning with the idea that has been lurking behind this whole series: the semantic layer.
Thanks for reading!
Thanks to NotebookLM for creating these nice-looking illustrations.